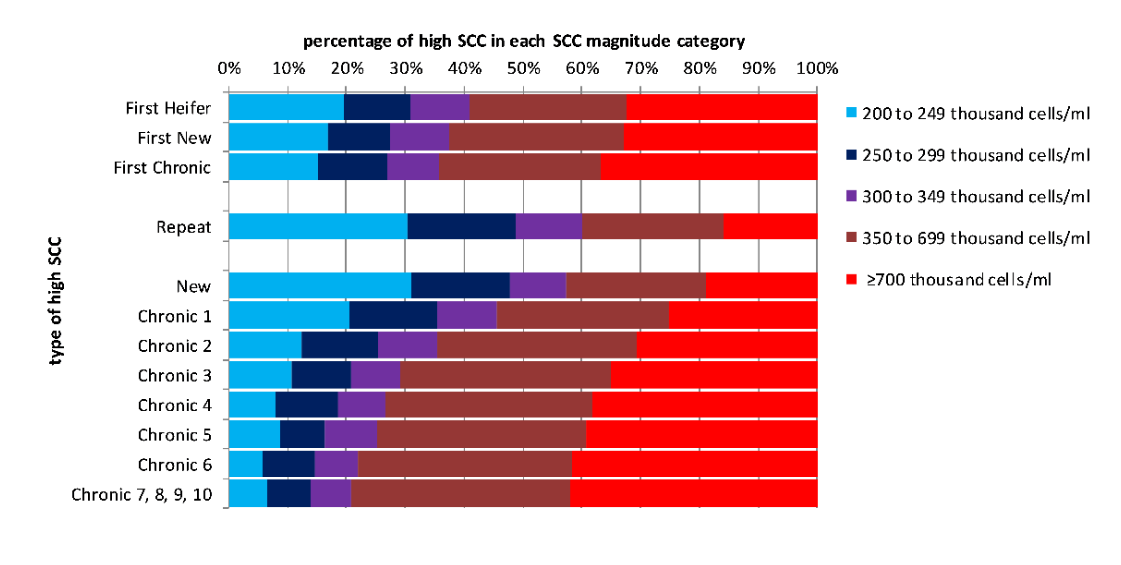
Figure 1: Distribution of high SCC MRs between SCC magnitude categories for the different categories of high SCC
An analysis of recovery probability from high somatic cell counts in UK dairy cows
Madeleine Archer BSc (Hons), MSc1
1School of Agriculture, Policy and Development, University of Reading, Whiteknights, PO Box 237, Reading, RG6 6AR, UK
*Corresponding Author (n.m.taylor@reading.ac.uk)
Vol 4, Issue 4 (2019)
Published: 11 Dec 2019
Reviewed by: Chris Watson (MA, VetMB, MRCVS) and John Fishwick (MA, VetMB, DCHP, DipECBHM, MRCVS)
DOI: 10.18849/VE.V4I4.205
Objective:
The particular interest of this study was to identify the relative impacts of magnitude and category of high SCC on ‘recovery’, once other factors were taken into account.
Background:
A high SCC (≥200 thousand cells/ml) is commonly associated with intra-mammary infection (IMI), one of the most economically important diseases faced by the dairy industry. High SCC is important in its own right because the bulk milk tank SCC is a determinant of the price farmers receive for their milk.
Evidentiary value:
A high SCC may be transient, returning (‘recovering’) to low SCC at the next monthly milk recording. Better understanding of factors influencing the probability of ‘recovery’ from high SCC, could improve decision making on how to manage cows with high SCCs in the most effective manner to minimise both production loss and unnecessary interventions that may include antimicrobial use.
Methods:
This research used monthly milk recording data to explore how the probability of ‘recovery’ from high somatic cell count (SCC) is associated with different factors such as parity, stage of lactation, the magnitude of SCC and category of high SCC (e.g. new or chronic). Different factors (SCC magnitude; category of high SCC, e.g. new or chronic; parity; and lactation stage) were analysed using a multilevel, mixed effect logistic regression model to assess the association with recovery probability. Data of 12,250 full lactation records from 499 milk-recorded UK dairy herds were used, from which 30,080 high SCC ‘cases’ were analysed.
Results:
In line with established evidence, increasing parity, increasing days in lactation and increasing magnitude of SCC are associated with decreased probability of recovery. The important result is that the category of high SCC is the most influential factor, with probability of recovery after two consecutive high SCC being around half or less the probability of recovery after just one high SCC.
Conclusion:
The results provide evidential support for category of high SCC to be used ahead of magnitude of SCC when advising farmers about prioritising high SCC cases for investigation and possible treatment, drying-off or culling.
Application:
Dairy herd management software companies should work with farmers and their advisors to ensure SCC data are presented in the most useful way, allowing easy interpretation and translation into the most effective interventions that can increase the efficiency of the dairy industry as well as avoiding needless or ineffectual interventions, that may include use of antimicrobials.
Mastitis, which is usually caused by bacterial intramammary infection (IMI), is one of the most economically damaging issues affecting the global dairy industry (Halasa et al., 2007 and van Soest et al., 2016).
High (≥200 thousand cells/ml) somatic cell count (SCC) has long been associated with IMI (Dohoo and Leslie, 1991; Bradley and Green, 2005) and SCC provided for monthly individual cow milk samples have commonly been used as an indicator of a herd’s mastitis situation, particularly subclinical mastitis. A high SCC in the absence of clinically apparent inflammation of the udder may indicate the presence of subclinical mastitis which is caused by contagious mastitis organisms, especially Staphylococcus aureus, Streptococcus dysgalactiae and Streptococcus agalactiae (Edmondson and Blowey, 1998), although 20–35% of milk samples taken from animals with a high SCC give a negative result to bacterial culture analysis (Herlekar et al., 2013). However, bacteria involved in environmental mastitis, mainly Escherichia coli and Streptococcus uberis are rapidly eliminated from the udder and clinical mastitis caused by these organisms is not closely linked with SCC (Edmondson and Blowey, 1998). In recent decades the relative importance of environmental mastitis in UK dairy herds has increased while contagious mastitis has decreased (Biggs, 2017a; Biggs, 2017b) limiting the utility of SCC as a direct indicator of clinical mastitis occurrence.
As well as a detrimental impact on milk yield, culling of cows and other costs associated with IMI (Halasa et al., 2007; van Soest et al., 2016), the SCC of individual cows’ milk is also important in its own right because it contributes to the SCC in the bulk milk tank. This is important because bulk milk tank SCC is one of the determinants of the price farmers receive for their milk, with premiums and penalties applied according to the milk supply contract. It is therefore important for dairy farmers to carefully manage the SCC of cows in their milking herd. This might include prevention and control of sub-clinical and clinical mastitis, treatment of clinical cases and management of sub-clinical cases, and also withholding high SCC milk from the bulk tank, and the culling of persistent high SCC cows.
A high SCC may be apparently transient, with milk returning to a low SCC at the subsequent milk recording (MR). Past research has focused on the factors which affect the occurrence of high SCC and the associations between high SCCs and herd productivity, reproduction and health (Archer et al., 2013; Morris et al., 2013). In contrast, this research explored how the probability of ‘recovery’ from high SCC is associated with different factors such as parity, stage of lactation, the magnitude of SCC and category of high SCC (e.g. new or chronic). The particular interest of this study was to identify the relative impacts of magnitude and category of high SCC on ‘recovery’, once the other factors were taken into account.
A better understanding of the factors influencing the probability of such ‘recovery’ could improve farmers’ and veterinarians’ decision making on how to manage cows with high SCCs in the most effective manner to minimise both unnecessary or ineffectual interventions that may include use of antimicrobials and loss in productivity.
This study examined sequential data from cows milk-recorded at monthly intervals to evaluate the probability that a high SCC case will return to a low SCC (‘recovery’) at the next MR. A multilevel, mixed effect longitudinal logistic regression analysis was carried out to assess the association of different factors (magnitude of SCC; the category of high SCC, e.g. new or chronic; parity of the cow; and stage in lactation) with lower or higher probability of ‘recovery’.
The data source for this study was a group of 500 UK dairy herds used in the University of Reading annual benchmarking survey for the year ending 31 August 2014 (Hanks and Kossaibati, 2014). These herds are randomly selected from a population of predominantly black and white (Holstein/Friesian) UK dairy herds that must be routinely milk-recorded and also meet minimum standards of event recording (including calving, service, pregnancy diagnosis, sales, culls). To ensure that complete lactation records were available, data for the lactations of all cows calving between 1 September 2012 and 31 August 2013 were extracted. Data were available from each MR during the lactations, carried out approximately monthly by National Milk Records (NMR). The data items extracted for each lactation included: herd identity (ID); animal ID; calving date; parity; dry date; SCC at the last MR of the previous lactation; total MRs recorded in the current lactation; dates of MRs and SCC results for up to the first 12 MRs in the current lactation. Using the herd ID, the average number of cows in each herd during the year between 1 September 2012 and 31 August 2013 was also derived. A ‘study population’ of lactations was extracted by excluding lactation records that did not include at least one MR with a high SCC (defined as ≥200 thousand cells/ml). Next, a random sample of 15,000 lactations was drawn from the study population using a randomised sorting process.
A number of records were removed from the initial selection of 15,000 lactations as these were found to be incomplete. The following cases were considered as incomplete: a) the sequence of milk records was incomplete with a gap of over 50 days between any of the MRs; b) there was just one MR for the entire lactation, and; c) there were obvious anomalies in the data such as having a MR date before calving date or after the dry date.
For the purpose of analysis a ‘case’ was a MR with SCC ≥200 thousand cells/ml and the outcome of a case was defined as ‘recovery’ when the SCC at the next month’s MR was <200 thousand cells/ml. The recovery probability for cases of high SCC MRs in the sample was estimated using a longitudinal multilevel logistic regression model in which the outcome (dependent variable) had the form of a binary variable where 1 was for a case that ‘recovered’ and 0 for those ‘not recovered’. The data structure takes the form of repeated measurements (Level 1) of SCCs nested (Level 2) within the individual cow which in turn is nested within a higher-level cluster (i.e. herd) at Level 3. Thus, we consider a 3 Level model in the analysis. The use of a multilevel model allows us to use a non-balanced data set since the frequency and number of measurements can vary amongst individuals (i.e. cows). The model is fitted using a generalised linear mixed model, which incorporates both fixed-effects parameters and random effects in a linear predictor, by maximum likelihood (Laplace Approximation). The objective is to predict the log-odds (recovery) for an individual cow in a herd. The technical details of this approach are beyond the scope of this article and the interested reader can investigate this further in the works of Quené and van den Bergh (2004), Baayen et al. (2008) and Goldstein (2003). The potential explanatory variables in the analysis were: stage of lactation (days in milk[1]); magnitude of SCC (cells/ml); the category of high SCC; parity of the cow and the average size of the herd. Each of these variables was defined in the multilevel model by assigning categories. The numbers of categories and the thresholds between categories were decided based on the initial exploration of the data using univariate techniques.
Each variable in the model was then assessed using series of ‘dummy’ variables which were compared to a reference case.
[1] Days in milk (DIM) in this analysis was derived as the difference between MR date and calving date, therefore the same as ‘days after calving’.
|
…if it is the first MR in the lactation… |
|
|
First Heifer |
Heifer calving with a high SCC in first MR |
|
First New |
Cow calving with a high SCC in first MR – the last MR of previous lactation was LOW |
|
First Chronic |
Cow calving with a high SCC in first MR – the last MR of previous lactation was HIGH |
|
…if it is NOT the first MR in the lactation… |
|
|
New |
The first high SCC in a lactation (that is not the first MR) |
|
Chronic i |
A high SCC consecutively following ‘i’ previous consecutive high SCCs (i = 1 … 10) |
|
Repeat |
A high SCC that follows a low SCC, but is NOT the first high SCC in the lactation |
Table 1: categories of High SCC and definition
Descriptive Results
The data cleaning reduced the sample dataset from 15,000 to 12,250 lactation records, each from a different animal from 499 different herds. These 12,250 lactation records contained data from 126,510 individual MRs, of which 36,731 (29%) had a high SCC. The outcome of high SCCs occurring at the twelfth and final MR extracted, or at the end of a lactation, could not be determined. Therefore, these MRs (6,651) were omitted from the analysis, leaving a total of 30,080 of high SCC cases in the analysis.
The distribution of cases by different categories of each of the variables used in the mixed effect logistic regression model, and the ‘raw’ recovery probabilities, are presented in Table 2. Consistent with other researchers’ findings (e.g. Schepers et al., 1997) and possibly related to decreasing yield resulting in higher concentration of cells present, a higher proportion of the high SCC MRs occurred in later lactation (>200 DIM) in particular 42% in the later stage compared with 29% in 1–100 days and 29% in 101–200 days. The magnitude of the high SCC was evenly distributed, with 35% less than 300 thousand cells/ml, 34% between 300 thousand and 699 thousand cells/ml and 32% ≥700 thousand cells/ml. 22% of the high SCC MRs were of the ‘New’ category, with a further 11% occurring at the first MR of the lactation and 16% being ‘Repeat’ highs. Therefore, just over 50% of the high SCC MRs were ‘Chronic’ (i.e. one of a sequence of consecutive high MRs within the lactation). The distribution of high SCC MRs by parity and by herd size reflected the distribution of the lactation records by parity and herd size indicating that there was no great tendency for high SCC to occur in any particular parity or herd size more than another.
|
Variable |
Category (level) |
All cases |
Recovery cases |
||
|
n |
% in each category |
n |
proportion |
||
|
Total cases used in analysis |
30,080 |
11,110 |
(0.37) |
||
|
Days in Milk (days) |
|||||
|
|
DIM.C1 (≤100)‡ |
8,653 |
(29%) |
4,225 |
(0.49) |
|
DIM.C2 (101 to 200) |
8,864 |
(29%) |
3,205 |
(0.36) |
|
|
DIM.C3 (>200) |
12,563 |
(42%) |
3,680 |
(0.29) |
|
|
Somatic Cell Count (thousand cells per ml) |
|||||
|
|
SCC.C1 (200 to 249)‡ |
6,171 |
(21%) |
3,275 |
(0.53) |
|
SCC.C2 (250 to 299) |
4,228 |
(14%) |
1,810 |
(0.43) |
|
|
SCC.C3 (300 to 349) |
2,900 |
(10%) |
1,088 |
(0.38) |
|
|
SCC.C4 (350 to 699) |
7,190 |
(24%) |
2,293 |
(0.32) |
|
|
SCC.C5 (SCC ≥700) |
9,591 |
(32%) |
2,644 |
(0.28) |
|
|
High SCC category (descriptive) |
|||||
|
|
New‡ |
6,735 |
(22%) |
4,047 |
(0.60) |
|
First Heifer |
1,017 |
(3%) |
736 |
(0.72) |
|
|
First New |
1,160 |
(4%) |
692 |
(0.60) |
|
|
First Chronic |
1,234 |
(4%) |
589 |
(0.48) |
|
|
Repeat |
4,752 |
(16%) |
2,180 |
(0.46) |
|
|
Chronic 1 |
5,449 |
(18%) |
1,528 |
(0.28) |
|
|
Chronic 2 |
3,192 |
(11%) |
595 |
(0.19) |
|
|
Chronic 3 |
2,088 |
(7%) |
278 |
(0.13) |
|
|
Chronic 4 |
1,485 |
(5%) |
203 |
(0.14) |
|
|
Chronic 5 |
1,013 |
(3%) |
98 |
(0.10) |
|
|
Chronic 6 |
733 |
(2%) |
63 |
(0.09) |
|
|
Chronic 7, 8, 9, 10 |
1,211 |
(4%) |
96 |
(0.08) |
|
|
Parity (number of calvings) |
|||||
|
|
First Calving (Heifer)‡ |
5,885 |
(20%) |
3,163 |
(0.54) |
|
Second Calving |
5,349 |
(18%) |
2,193 |
(0.41) |
|
|
Third Calving |
5,873 |
(20%) |
2,108 |
(0.36) |
|
|
Fourth to Sixth Calving |
10,242 |
(34%) |
2,958 |
(0.29) |
|
|
Seventh and above calvings |
2,731 |
(9%) |
688 |
(0.25) |
|
|
Size of the herd (number of cows) |
|||||
|
|
Small (≤100 cows)‡ |
4,858 |
(16%) |
1,711 |
(0.35) |
|
Medium (101 to 200 cows) |
13,653 |
(45%) |
5,002 |
(0.37) |
|
|
Large (>200 cows) |
11,569 |
(38%) |
4,397 |
(0.38) |
|
‡ used as the reference case in the multilevel, mixed effect logistic regression model
Table 2: Distribution of cases by different categories of each of the variables used in the multilevel, mixed effect logistic regression model and the ‘raw’ recovery probabilities
Overall, 37% of the high SCC MRs were followed by a SCC lower than 200 thousand cells/ml (representing the overall probability of ‘recovery’ across all cases). The proportion of cases ‘recovering’ was similar for the three herd size categories. Table 2 shows that the proportion of cases ‘recovering’ after a high SCC declined with increasing DIM, increasing magnitude of SCC and increasing parity. When all chronic cases are aggregated, the recovery probability is 19% (2,861/15,171) compared with the aggregate recovery probability of the rest of the cases of 55% (8,244/14,898). For the ‘Chronic 1’, ‘Chronic 2’, ‘Chronic 3’ etc. categories of high SCC in particular, the proportion of recoveries declines as the chronic sequence progresses.
Figure 1 shows the distribution of high SCC MRs between SCC magnitude categories for the different categories of high SCC.
Although the ‘New’ high SCC MRs and the ‘Repeat’ high SCC have a similar profile (over 30% have a value of <250 thousand cells/ml and almost 50% are <300 thousand cells/ml) (Fig. 1) the proportion of cows recovering from ‘Repeat’ high SCC MRs is lower compared to recovery from “New” high SCC MRs (Table 2). In addition, although the three categories of ‘First’ high SCC MRs include similarly high proportions with SCCs ≥700 thousand cells/ml and fewer SCCs of <300 thousand cells/ml, the proportion of cows recovering for the ‘First Heifer’ and ‘First New’ categories are at least as high as for a ‘New’ high SCC (Table 2). However, the proportion that recover from the ‘First Chronic’ category is much lower (Table 2). These findings suggest that for these categories of high SCC at least, recovery probability is influenced by factors other than simply the magnitude of high SCC.
High SCC MRs that are in a chronic sequence show a progressive trend to higher magnitude SCC categories up to the sixth consecutive high SCC (Fig.1). This is in parallel with progressively lower recovery probability (Table 2). High SCC in the sequence beyond ‘Chronic 6’ have a similar SCC profile and similar proportion of recovery.
Figure 2 shows the distribution of high SCC MRs between SCC magnitude categories for different parities.
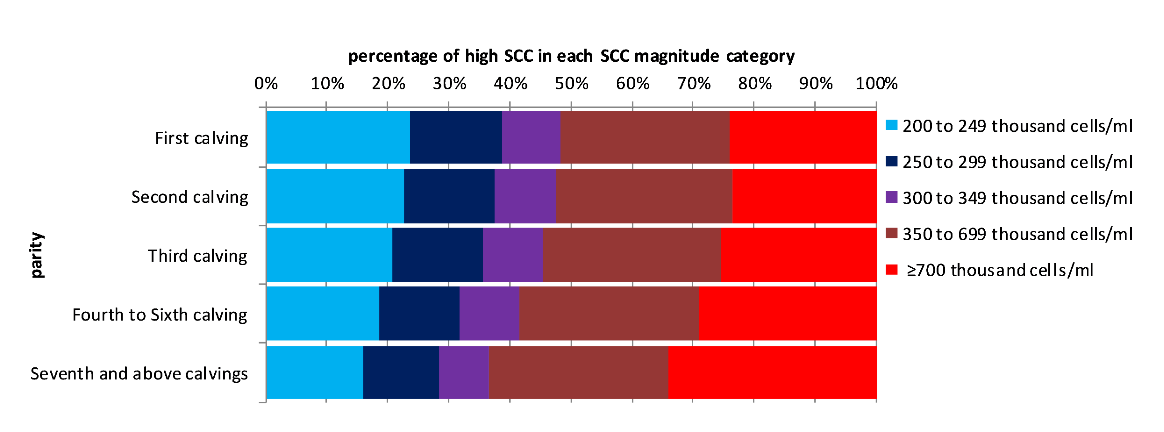
On aggregate, 29% of high SCC in parity 3 and above had a magnitude of ≥700 thousand cells/ml, compared with 23% in second parity and 24% in first parity. The proportions of lower magnitude SCC categories tend to decrease and higher magnitude SCC categories tend to increase with increasing parity. This is in parallel with progressively lower recovery probability with increasing parity (Table 2).
A separate breakdown of high SCC type between different parities also showed that the proportion of high SCC that were chronic was greater in higher parities (55% chronic in parity 3 and above, compared with 47% in second parity and 39% in first parity).
Figure 3 shows the distribution of high SCC MRs between SCC magnitude categories for different stages of lactation.
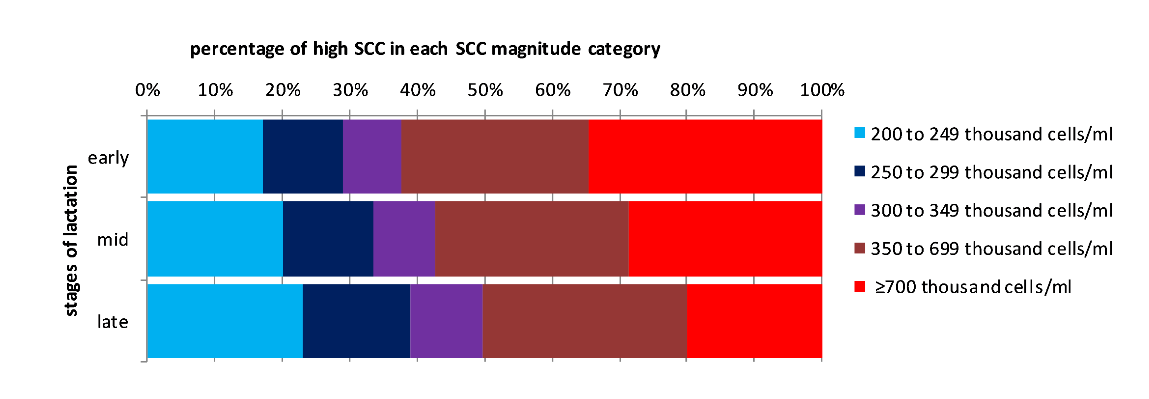
The proportion of very high magnitude high SCC decreases from early to late lactation, whilst the probability of recovery also decreases (Table 2).
A separate breakdown of high SCC type between different stages of lactation also showed that the proportion of high SCC that were chronic was greater in mid and late lactation compared with early lactation (58% and 57% chronic in late and mid lactation, compared with 33% in early lactation).
Odds and probability of recovery estimated by mixed effect logistic regression modelling
The above descriptive analysis indicated that the magnitude and category of high SCC, the parity of the lactation and the stage of lactation could all influence the recovery probability (Table 2). However, Figures 1, 2 and 3 show that these factors are potentially confounded, so the descriptive analysis alone cannot determine the relative importance of these three factors. Therefore, a multilevel longitudinal logistic regression model was used to clarify the associations between the various explanatory factors and recovery probability. The results of the mixed effect logistic regression model are summarised in Table 3.
|
RANDOM EFFECTS |
|
|
|
|
|
|
Groups |
Name |
Variance |
|
Standard Deviation |
|
|
Individual Animal |
(Intercept) |
0.03862 |
|
0.1965 |
|
|
Herd |
(Intercept) |
0.04488 |
|
0.2118 |
|
|
FIXED EFFECTS |
|
|
|
|
|
|
Variable |
Level |
Estimate |
Standard Error |
odds/Odds Ratio |
95% confidence interval |
|
Fixed Effects |
|
|
|
|
|
|
Intercept |
|
1.58** |
0.07 |
4.85 |
4.23–5.57 |
|
Days in Milk (days) |
DIM.C1 (≤ 100)‡ |
0.00 |
|
|
|
|
DIM.C2 (101 to 200) |
-0.08* |
0.04 |
0.92 |
0.85–1.00 |
|
|
DIM.C3 (> 200) |
-0.41** |
0.04 |
0.67 |
0.61–0.72 |
|
|
SCC (thousand cells per ml) |
SCC.C1 (200 to 249)‡ |
0.00 |
|
|
|
|
SCC.C2 (250 to 299) |
-0.30** |
0.04 |
0.74 |
0.68–0.81 |
|
|
SCC.C3 (300 to 349) |
-0.47** |
0.05 |
0.62 |
0.56–0.69 |
|
|
SCC.C4 (350 to 699) |
-0.66** |
0.04 |
0.52 |
0.48–0.56 |
|
|
SCC.C5 (SCC ≥ 700) |
-0.82** |
0.04 |
0.44 |
0.41–0.48 |
|
|
High SCC category (descriptive) |
New‡ |
0.00 |
|
|
|
|
First Heifer |
-0.07 |
0.09 |
0.94 |
0.79–1.11 |
|
|
First New |
0.06 |
0.07 |
1.06 |
0.92–1.22 |
|
|
First Chronic |
-0.27** |
0.07 |
0.76 |
0.66–0.87 |
|
|
Repeat |
-0.54** |
0.04 |
0.58 |
0.53–0.63 |
|
|
Chronic 1 |
-1.25** |
0.04 |
0.29 |
0.26–0.31 |
|
|
Chronic 2 |
-1.68** |
0.06 |
0.19 |
0.17–0.21 |
|
|
Chronic 3 |
-2.01** |
0.08 |
0.13 |
0.12–0.15 |
|
|
Chronic 4 |
-1.93** |
0.09 |
0.15 |
0.12–0.17 |
|
|
Chronic 5 |
-2.28** |
0.12 |
0.10 |
0.08–0.13 |
|
|
Chronic 6 |
-2.28** |
0.14 |
0.10 |
0.06–0.13 |
|
|
Chronic 7, 8, 9, 10 |
-2.41** |
0.11 |
0.09 |
0.07–0.12 |
|
|
Parity (number of calvings) |
First Calving (Heifer)‡ |
0.00 |
|
|
|
|
Second Calving |
-0.49** |
0.05 |
0.61 |
0.56–0.67 |
|
|
Third Calving |
-0.65** |
0.05 |
0.52 |
0.47–0.57 |
|
|
Fourth to Sixth Calving |
-0.92** |
0.05 |
0.40 |
0.37–0.44 |
|
|
Seventh and above calvings |
-1.04** |
0.07 |
0.35 |
0.31–0.40 |
|
|
Size of the herd (number of cows) |
Small (≤100 cows)‡ |
0.00 |
|
|
|
|
Medium (101 to 200 cows) |
0.01 |
0.05 |
1.01 |
0.92–1.11 |
|
|
Large (>200 cows) |
0.06 |
0.0 |
1.06 |
0.96–1.17 |
|
‡ used as the reference case in the multilevel, mixed effect logistic regression model
Statistical significance indicated by asterisks: ** p<=0.001; * p<=0.05
Null Deviance = 32998.4 (on 30040 df), Pseudo-R2: Marginal = 0.27 (represents the variance explained by the fixed effects), Conditional = 0.28 (is interpreted as a variance explained by the entire model, including both fixed and random effects) . AIC = 33056.4 < AIC Null model (just the random effects) = 36730.6; BIC = 33297.5 < BIC Null model (just the random effects) = 36755.5
Table 3: Summary of the multilevel, mixed effect logistic regression
The results of the model provide information on both the random as well as the fixed effects within the sample. The different measurements and hence recovery probabilities are considered for each individual animal which is also clustered within different herds. According to the outcome of the model, small variability is observed amongst the individual animals (0.0386) and the same can be concluded for the variability amongst the different herds (0.04488).
In Table 3 the intercept is the log of the estimated odds of recovery for the reference case of high SCC (i.e. a first parity animal in a small herd that is in early lactation with a ‘New’ high SCC of 200–249 thousand cells/ml). This is referred to as the overall intercept in the linear relationship between the log of odds and the independent variables of the model. The antilog of this gives the odds of recovery (4.85). The estimate for each level of each variable is the log of the odds ratio (OR) comparing the odds of an animal recovering with the odds for the reference case. The antilog of this estimate gives the OR itself, which is shown in Table 3 with the 95% confidence interval. If the 95% confidence interval of the OR does not include unity then there is a significant difference (p<=0.05) in recovery odds, and also probability, between the reference case and a case in which only that factor is different (at the relevant level). A statistically significant association was not observed between herd size and recovery probability, but we chose to keep the herd size factor in the model for completeness having checked that removing the factor did not affect the other estimates.
Recovery odds can be converted to recovery probability (expressed as a decimal number between 0 and 1), which is easier to interpret, using the equation: probability = odds / (1+odds). For the reference case this gives a recovery probability of [4.85 / (1 + 4.85)] = 0.83 (i.e. the model suggests that 83% of cases like the reference case are expected to recover).
Table 4 shows the estimated recovery probabilities for cases that differ from the reference case in only one aspect at each level of the different variables in the model. For example, the recovery probability for a case with SCC category 2 (with other variables the same as the reference case) is estimated as 0.78.
The results of the mixed effect logistic regression model, as shown in Tables 3 and 4, indicate that the ‘First Heifer’ and ‘First New’ category of high SCC did not have significantly different recovery probability for when compared to the reference case (‘New’). Most importantly, Table 4 clearly indicates that the chronic categories of high SCC are associated with the most dramatic reductions in recovery probability. The model indicates that the recovery probability is dramatically reduced even after just two consecutive high SCC, from 0.83 (reference case) to 0.58 (‘Chronic 1’). The estimated recovery probabilities for ‘Chronic 2’ and above are increasingly reduced. Increasing magnitude of SCC also significantly reduces recovery probability, but by a smaller margin than even ‘Chronic 1’ compared to ‘New’.
|
Variable |
Level |
Probability |
|
Intercept (Reference case) |
DIM ≤100; SCC 200 to 249; ‘New’; First Calving; Small herd (≤100 cows) |
0.83** |
|
Days in Milk (days) |
DIM.C2 (101 to 200) |
0.82* |
|
DIM.C3 (>200) |
0.76** |
|
|
SCC (thousand cells per ml) |
SCC.C2 (250 to 299) |
0.78** |
|
SCC.C3 (300 to 349) |
0.75** |
|
|
SCC.C4 (350 to 699) |
0.72** |
|
|
SCC.C5 (SCC ≥ 700) |
0.68** |
|
|
High SCC category (descriptive) |
First Heifer |
0.82 |
|
First New |
0.84 |
|
|
First Chronic |
0.79** |
|
|
Repeat |
0.74** |
|
|
Chronic 1 |
0.58** |
|
|
Chronic 2 |
0.47** |
|
|
Chronic 3 |
0.39** |
|
|
Chronic 4 |
0.41** |
|
|
Chronic 5 |
0.33** |
|
|
Chronic 6 |
0.33** |
|
|
Chronic 7, 8, 9, 10 |
0.30** |
|
|
Parity (number of calvings) |
Second Calving |
0.75** |
|
Third Calving |
0.72** |
|
|
Fourth to Sixth Calving |
0.66** |
|
|
Seventh and above calvings |
0.63** |
|
|
Size of the herd (number of cows) |
Medium (101 to 200 cows) |
0.83 |
|
Large (>200 cows) |
0.84 |
Statistical significance indicated by asterisks: ** p<=0.001; * p<=0.05
Table 4: Estimates of recovery probability for each level of the different variables
Examples of estimating the expected recovery probabilities for specific high SCC cases using the output of the regression model
The expected recovery odds for cases with any combination of variable levels can be estimated by summing all the relevant log ORs (for different variable levels) and adding to the log odds (intercept/reference case), then antilogging. The odds can then be converted to probability of recovery using the equation: probability = odds/(1+odds). For example, Figures 4a and 4b show the estimated recovery probabilities for a third parity cow in a medium sized herd. Figure 4a illustrates expected recovery probabilities for different categories of high SCC occurring in mid-lactation, by magnitude of SCC. Figure 4b illustrates expected recovery probabilities for different categories of high SCC, with a SCC between 300 and 349 thousand cells/ml, by stage of lactation. Note that these recovery probabilities represent the expectation for the ‘average’ high SCC case in the dataset used for this analysis. These charts show that more than 50% of ‘New’ high SCC cases may be expected to recover regardless of the magnitude of the SCC or stage of lactation, within the range of the scenarios illustrated. In contrast less than 40% of ‘Chronic’ high SCC cases may be expected to recover in all comparable scenarios. The recovery probability for a ‘Repeat’ high SCC may be above or below 50% depending on the magnitude of the SCC.
Figure 4 demonstrates the large difference in recovery probabilities between ‘New’ and ‘Chronic’ cases. In particular there is a large decrease in recovery probability between ‘New’ and ‘Chronic 1’. Recovery probability declines further as a consecutive high SCC sequence progresses. Note that the model does not estimate significantly different recovery probabilities for ‘Chronic 3’ and ‘Chronic 4’ or for any cases including and beyond ‘Chronic 5’.
The slopes of the lines in Figure 4a flatten out as the categories of high SCC move from ‘New’ to ‘Chronic 1’ through to ‘Chronic 7, 8, 9, 10’. This indicates that the magnitude of SCC becomes less influential for recovery probability in these chronic cases.
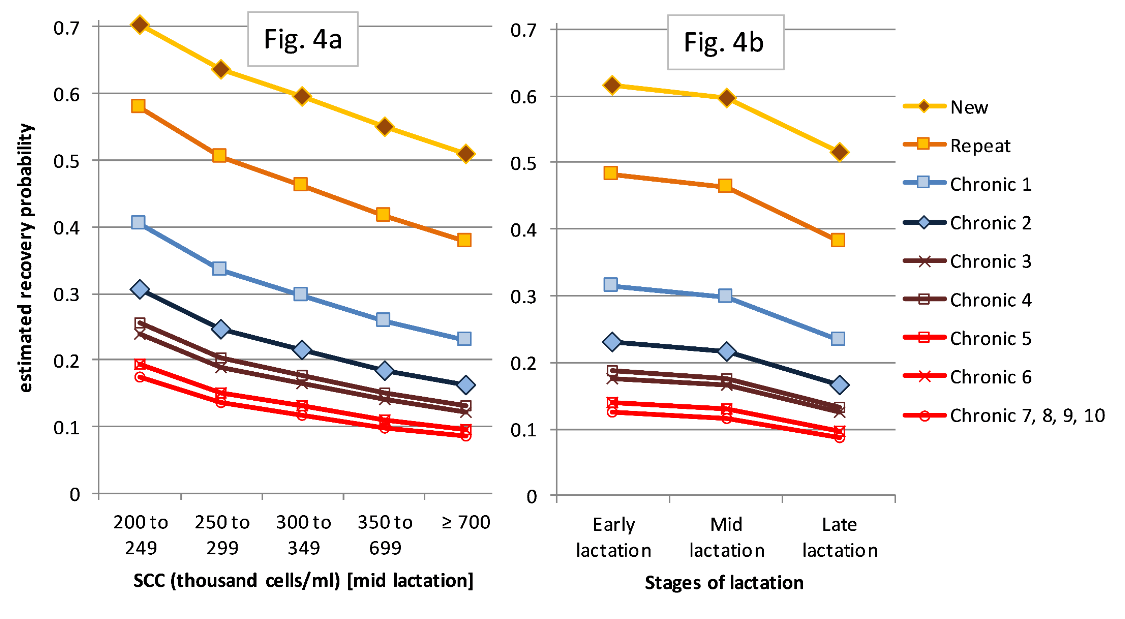
Figure 4b shows that expected recovery rates are slightly lower in late lactation than in early and mid-lactation. However, the impact of type of high SCC is far greater: for all magnitudes of high SCC, except the very lowest, and in all stages of lactation expected recovery probability for a chronic 1 high SCC (i.e. after just two consecutive high SCC) is around half or less of the probability for a ‘New’ high SCC.
Late stage of lactation, increasing magnitude of SCC and increasing parity of the cow all have significant influence on decreasing recovery probability, but the most dramatic reductions in recovery probability are associated with chronic high SCC. The expected recovery probability after just two consecutive high SCCs is around half or less the probability expected for a ‘New’ high SCC. None of the factors other than chronicity reduce the recovery probability by more than 0.2 on average, but having even just two consecutive high SCC (i.e. ‘Chronic 1’) reduces the recovery probability by over 0.2 on average. Once there have been three or more consecutive high SCC (‘Chronic 2’ and above) the recovery probability is reduced by between 0.3 and 0.5. As an example, Figure 4a shows that ‘on average in this dataset’ a mid-lactation third parity cow with a ‘New’ high SCC has a greater than 50% recovery probability even if the SCC is ≥700 thousand cells/ml whereas a similar cow with any chronic high SCC has a less than 50% recovery probability regardless of the magnitude of the SCC.
Limitations and strengths of the study
A limitation in the data is that there is no information about management interventions or treatments applied to the high SCC cases, which would doubtless be an important determinant of recovery. However, compared to the number of high SCC cases included in the dataset, the number of interventions is likely to be small enough as to have little effect on the main conclusions of the study. The monthly frequency of MRs also means that shorter term variations in SCC, particular above and below 200 thousand cells/ml, are not captured. However, this analysis is based on exactly the same quality of data as is routinely available to farmers and veterinarians and therefore the results should be directly applicable to the ‘real world’ situation they face. This large dataset provides an overview of ‘average’ probabilities that high SCC cases will recover to low SCC at the next month’s MR, under prevailing ‘real-life’ conditions (which no doubt included a variety of interventions in some cases) and as such, provides valid evidence to support decisions about management of SCC in farmers’ herds. The analysis is based on a sample of high SCC cases from 499 UK dairy herds. While there may be different herd-specific factors influencing recovery in individual herds, the trends in recovery probabilities observed in this dataset could reasonably be expected to apply to other similar dairy herds in UK.
The descriptive analysis of the data showed that factors that potentially influence the probability of recovery from a high SCC to low are inter-linked. For example: high magnitude SCC (≥700 thousand cells/ml) have a lower recovery probability; chronic high SCC have a lower recovery probability (decreasing as the chronic sequence progresses); also the percentage of high SCC with ≥700 thousand cells/ml is increased in chronic high SCC (and increasing as the chronic sequence progresses) and also a higher percentage of high magnitude SCC are chronic compared to lower magnitude SCC. So, the question arises as to whether the reduced recovery probabilities seen in high magnitude SCC and chronic SCC are related to the magnitude of SCC or the chronicity of the high SCC, or a combination of both factors. The multilevel, mixed effect logistic regression model analysis, including several factors in the one model is a tool to answer this question. Fitting the data in a regression model is a way to estimate the significance and relative strengths of the influences of several different factors on recovery probability when all factors are taken into account together.
Implications of the results
Dealing with cows with persistently high SCC is important because there is a strong correlation between the percentage of chronic high SCC recorded by a herd and the herd average SCC, reflected in the bulk milk SCC (BMSCC) that may determine price penalties. Hanks and James (2011) discussed the need for monitoring cows with chronic high SCC and preventing cows persisting with chronic high SCC. Analysis of annual key performance indicators in 500 herds showed that of herds where under 10% of milk samples were classed as chronic high SCC, just 9% had an annual average herd cell count above the penalty level of 200 thousand cells/ml. On the other hand, of herds where over 15% of milk samples were classed as chronic high SCC, 92% had an annual average herd cell count above the penalty level. While the numbers of herds with under 10% of milk samples classed as chronic high SCC has increased over the years, and the numbers of herds with over 15% of milk samples classed as chronic high SCC has decreased, the relationship between the percentage of chronic high SCC recorded and the average herd SCC has remained both qualitatively and quantitatively consistent (Hanks and Kossaibati, 2018).
A high SCC may be apparently transient, returning (‘recovering’) to low SCC at the next monthly milk recording. With better understanding of factors influencing the probability of ‘recovery’, decision making on how to manage cows with high SCCs in the most effective manner to minimise both production loss and unnecessary interventions that might include antimicrobial use could be improved. Recognising factors associated with an increased probability that a cow will ‘recover’ from a high SCC, e.g. a ‘New’ high SCC in a young cow, not in late lactation, would support a decision not to intervene. On the other hand, these results show a dramatic and progressive reduction in recovery probability for chronic high SCC cases after just two consecutive high SCC. This supports prioritising management intervention for cows that record two consecutive high SCC, rather than continue to ‘wait and see next month’ (e.g. bacteriological sampling, only to be followed by use of appropriate antimicrobials if clinically justifiable). Sol et al. (1997) presented an analysis of factors associated with success rates of in-lactation treatment of subclinical mastitis. Among their findings was that lower SCC resulted in a better cure rate, which suggests the treatment option should only be considered favourably for cows with a chronic sequence of high SCC if the magnitude of high SCC is not too great. If a cow has had more than two consecutive high SCC, alternative interventions such as drying-off the affected quarter only, early dry-off with antimicrobial dry cow therapy or cull may be considered. Deluyker et al. (2005) also present analysis of factors affecting cure and also reduction in SCC after different interventions on sub-clinical mastitis. Significant factors included bacteriological factors, highlighting the importance of bacteriological investigation before making intervention decisions.
These results could be utilised in a decision-support application to be applied at cow level to assess recovery probability and compare the estimated cost of not intervening with the costs and benefits of intervention options such as early drying-off, cull or other ‘in-lactation’ treatments. An application could take into account the factors included in the analysis presented here and several other factors such as the recorded SCC and mastitis history of the cow in previous lactations, the likelihood of a treatment to succeed, and the potential loss of milk output versus the potential reduction in bulk milk tank SCC if a high SCC is dried-off early. Evidence from other studies could be included in such an application: for example Sol et al. (1997) and Deluyker et al. (2005).
Dairy herd management software frequently presents SCC reports that sort in descending order of SCC magnitude, leading the farmer to focus attention on the cows with the highest SCC. This analysis clearly shows that the category of high SCC (SCC history, chronicity) is a more important consideration in terms of the prognosis for the cow and the most important factor to consider when deciding on the course of action. Furthermore, this analysis has brought out the importance of including the number of consecutive high SCC associated with a chronic high SCC in reports. Cows having had two consecutive high SCC (‘Chronic 1’ in this study) should be highlighted separately from cows with more consecutive high SCC MRs. Currently dairy herd management software often presents the percentage of chronic high SCC, but if farmers are targeting SCC management interventions particularly on the ‘Chronic 1’ cases, the success of SCC management could be assessed by monitoring the percentage of ‘Chronic 2’ and above. Dairy herd management software is capable of presenting this level of detail. Dairy herd management software companies should work with farmers and their advisors to ensure SCC data are presented in the most useful way, allowing easy interpretation and translation into the most effective interventions that can increase the efficiency of the dairy industry as well as avoiding needless or ineffectual interventions, that may include use of antimicrobials.
Acknowledgments: The authors would like to thank the farmers who gave permission for their data to be used in this analysis and National Milk Records (NMR) for making the data accessible.
Funding: The authors would like to thank the University of Reading for providing funding for the first author under the Undergraduate Research Opportunity Programme (UROP).
Competing interests: The authors declare no conflict of interest.
Intellectual Property Rights
Authors of articles submitted to RCVS Knowledge for publication will retain copyright in their work, and will be required to grant to RCVS Knowledge a non-exclusive licence of the rights of copyright in the materials including but not limited to the right to publish, re-publish, transmit, sell, distribute and otherwise use the materials in all languages and all media throughout the world, and to licence or permit others to do so.
Disclaimer
Any opinions expressed in articles and other publication types published in Veterinary Evidence are the author's own and do not necessarily reflect the view of the RCVS Knowledge. Veterinary Evidence is a resource to help inform, and the content herein should not override the responsibility of the practitioner. Practitioners should also consider factors such as individual clinical expertise and judgement along with patient’s circumstances and owners’ values. Authors are responsible for the accuracy of the content. While the Editor and Publisher believe that all content herein are in accord with current recommendations and practice at the time of publication, they accept no legal responsibility for any errors or omissions, and make no warranty, express or implied, with respect to material contained within. For further information please refer to our Terms of Use.